
Create an All-Weather Core strategy
Basic Risk Premia Harvesting

Over the long run, investors are compensated not for being clever, but for bearing risk that others are unwilling or unable to take. This simple idea sits at the heart of risk premia harvesting. Risk premia harvesting is a systematic approach to earning returns by gaining exposure to well-documented sources of compensated risk, accepting periods of discomfort and underperformance in exchange for long-term rewards.
What is a risk premium?
At its core, a risk premium is the extra return an investor expects to earn for bearing a specific type of risk. If an investment were completely risk-free, there would be no reason to expect returns beyond the risk-free rate. Any return above that rate is compensation for uncertainty, volatility or other forms of risk.
Common examples include:
Equity risk premium: Extra return for investing in stocks instead of risk-free assets
Credit risk premium: Compensation for lending to borrowers who may default
Liquidity risk premium: Higher returns for holding assets that are harder to trade
Term premium: Extra return for holding long-term bonds instead of short-term ones
These premia are not random. They persist because the underlying risks cannot be eliminated—only transferred.
Risk Premia Harvesting
Risk premia harvesting refers to systematically capturing these long-term sources of return through disciplined, rules-based investment strategies.
Rather than trying to predict market movements or identify undervalued securities, risk premia strategies focus on:
Identifying well-documented sources of compensated risk
Gaining exposure to those risks in a transparent and repeatable way
Maintaining exposure over time to benefit from their persistence
In essence, it is about earning returns for taking risks that investors are structurally rewarded for bearing, rather than relying on market timing or manager intuition.
I chose the following 3 assets:
URTH – Growth engine
Global developed-market equities
Highest expected return
Suffers most in recessions and crashes
TLT – Deflation & recession hedge
Long-duration U.S. Treasuries
Performs well in:
Recessions
Equity crashes
Deflation
Very sensitive to interest rates
GLD – Inflation & currency hedge
Performs best in:
Inflation shocks
Currency debasement
Geopolitical stress
Low correlation to both stocks and bonds
URTH is the MSCI World ETF, TLT is a long-duration U.S. Treasuries ETF and GLD is a gold ETP. Together, these three assets hedge different macro regimes. In the following table is an overview of how these assets behave in different macro regimes.
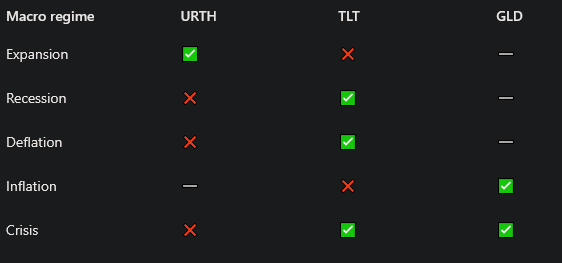
Expansions reward risk-taking. Equities dominate, while defensive assets lag. Recessions flip the script. Earnings contract, risk appetite fades and investors searching for safe havens. Gold remains neutral. While it can act as a hedge, its performance during recessions is inconsistent and highly dependent on policy responses and inflation expectations.
In deflationary environments, long-term bonds are one of the most powerful portfolio defenses. Inflation presents a more complex challenge. Equities can sometimes keep up, particularly if companies have pricing power, but margins are often squeezed. Gold, on the other hand, is historically one of the most effective inflation hedges.
Crises reward assets that provide safety, liquidity and trust.
So, these assets are independent of each other. The following table shows the correlation matrix of these assets.
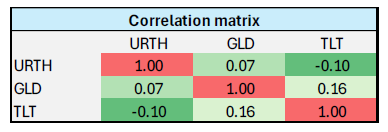
The correlation between URTH and GLD is 0.07, which is effectively neutral. The near-zero correlation suggests that gold and global equities generally move independently of one another. Holding gold alongside global equities can reduce overall portfolio volatility without necessarily sacrificing long-term return potential.
The relationship between URTH and TLT shows a –0.10 correlation, indicating a mild inverse relationship. While the correlation is not strongly negative, it does suggest that Treasuries can provide some defensive characteristics against equity risk. TLT offers partial downside protection against equity risk, especially during risk-off environments, making it a valuable ballast in diversified portfolios.
The correlation between GLD and TLT is 0.16, indicating a weak positive relationship. However, the correlation remains low, meaning they still provide diversification relative to one another. Gold is influenced by factors such as inflation expectations and currency movements, while Treasuries are more sensitive to interest rates and growth expectations. Gold and Treasuries can coexist in a defensive allocation without becoming redundant.
None of the pairwise correlations are high, which is precisely what investors want when building resilient portfolios. The combination suggests that blending global equities, gold and long-term bonds can smooth returns across economic cycles, reduce drawdowns and improve risk-adjusted performance. This creates essentially a three-asset “all-weather” core portfolio.
Keep in mind that no relationship is perfectly stable over time, the low and modest correlations among URTH, GLD and TLT can change.
For investors based in Europe, these ETFs are not directly tradable due to regulatory restrictions. Instead, it is necessary to use their UCITS-compliant equivalents. The following are the UCITS ETFs I have chosen for this purpose:
URTH —> EUNL
GLD —> PPFB
TLT —> IS04
Implementation
The essential starting point is to clearly understand the objective of this strategy. It is designed as a buy-and-hold approach that maintains exposure to a diversified set of assets and periodically rebalances the portfolio back to predefined target weights. The purpose of rebalancing is to preserve the intended risk structure over time as asset prices move.
The primary strength of this approach lies in its simplicity and robustness. By keeping exposures relatively constant, the portfolio is continuously positioned to earn multiple risk premia across different assets and market environments. This makes it a strong foundational framework for diversification at the portfolio level. Importantly, the strategy is not intended to deliver a high Sharpe ratio or outperform in every regime; rather, it aims to be reliable over long horizons.
Any changes or deviations from this design should be understood as creating an entirely different strategy, not as an improvement to the original one. There is a strong temptation to “enhance” the approach, especially when certain assets underperform for extended periods. When parts of the portfolio are not working, fine-tuning can feel like the logical response. However, such adjustments typically introduce new assumptions, new risks and often implicit market timing. While these may be valid in their own right, they represent a shift in philosophy rather than a refinement of the original strategy.
Insertion - a word of caution
What should be avoided is trying to fine-tune allocations in anticipation of the “next” macro regime. Economic regimes are notoriously difficult to identify in real time and are usually clear only in hindsight. Forecast-driven portfolio shifts often introduce more error than insight. Portfolios must be constructed before uncertainty resolves, not after.
Personal guesses of market movements have no place in a systematic portfolio!
Now back to the main part.
Ultimately, this framework highlights a central truth of long-term investing: diversified, regime-aware allocations are not designed to win every time in every environment. Their purpose is far more durable, to survive periods of stress, adapt as conditions change and compound capital across full market cycles.
Size matters
The next major objective is to determine how to combine these three assets into a single, coherent strategy. Once the building blocks are defined, the critical question becomes position sizing: how much capital should be allocated to each asset?
This is where volatility becomes a central consideration. Assets do not contribute risk in proportion to their capital weight. An asset with higher volatility can have a much larger impact on portfolio fluctuations than a lower-volatility asset, even if the dollar allocation is the same. As a result, naïvely assigning equal weights can lead to an unintended concentration of risk.
Using volatility as a sizing metric allows the portfolio to be structured around risk contribution rather than capital allocation. By accounting for how much each asset tends to fluctuate, weights can be adjusted so that each one plays a balanced role in the portfolio.
For this reason, it is helpful to define reasonable volatility ranges for each asset. These ranges provide a practical guide for setting portfolio weights and help ensure that the allocation remains stable across market environments.
The typical range for volatility of these assets should be the following:
URTH 15% – 18%
TLT 13% – 15%
GLD 12% – 16%
The observed volatility ranges across the assets largely overlap, without big differences.
With that context in mind, the next step is to compare an equal-weight allocation with an inverse-volatility-weighted allocation using a simple, back-of-the-napkin framework. Rather than aiming for precision, this comparison is meant to build intuition about how much difference volatility-based weighting can realistically make. The goal is to assess whether the added complexity of inverse volatility weighting meaningfully changes the portfolio’s risk profile, or whether it largely replicates the behavior of a simpler equal-weight approach.
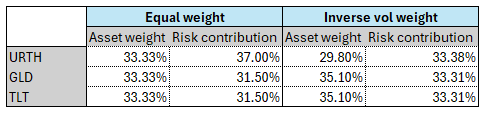
In this particular case, the inverse-volatility approach does not differ in any meaningful way from an equal-weight allocation. Given this lack of material difference, I think it is reasonable to favor the equal-weight approach. It achieves nearly the same outcome while remaining simpler and easier to implement and maintain. Choosing equal weighting avoids unnecessary complexity without sacrificing the core risk-balancing objective, making it a more practical and robust choice in this context.
Rebalancing rule
I will rebalance the portfolio on a monthly schedule, as this cadence aligns well with the my overall portfolio philosophy. Monthly rebalancing strikes a reasonable balance between keeping the portfolio close to its target allocations and avoiding excessive trading.
That said, a slower rebalancing frequency, such as quarterly, can also be perfectly adequate. Less frequent rebalancing naturally reduces turnover and transaction costs, which can meaningfully improve net returns over time. In many cases, slower rebalancing is not only sufficient but preferable, as it preserves the long-term intent of the strategy while keeping implementation simple and cost-efficient.
The rebalancing will only happen, if any asset deviates by 20% from target weight.
The Results
Before examining the results of the overall strategy, it is useful to first break down and analyze the performance of its three individual components. This step helps clarify how each element contributes to the final outcome and provides better insight into the sources of return and risk. We begin this analysis with URTH.
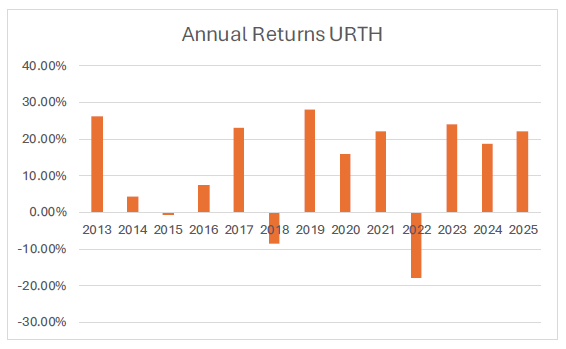
The annual returns of URTH show a clear upward trajectory over the period considered. The trend is positive, with the vast majority of years delivering positive returns. Only three years experienced declines.
The next component is GLD.
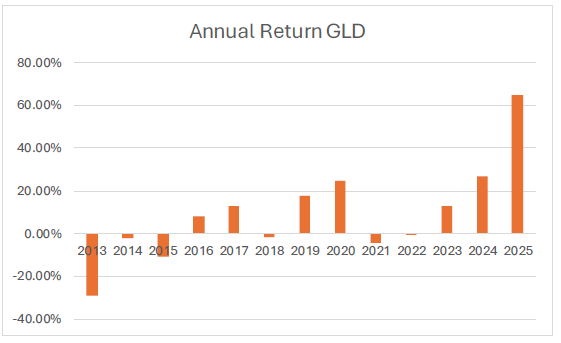
GLD shows a clear shift in performance over time, moving from a challenging early period to much stronger results in the later years. Especially the year2025 shows an outlier performance.
The final component to be analyzed is TLT.
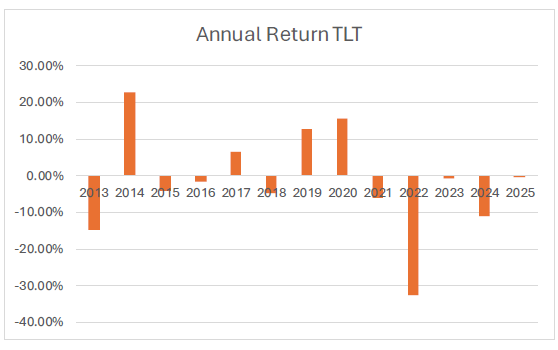
The results for TLT are mixed. Its returns are highly sensitive to the interest-rate environment. While the asset can deliver strong positive performance during periods of falling yields or market stress, it is also vulnerable to prolonged losses when rates rise.
Let’s now compare the results of the individual components.
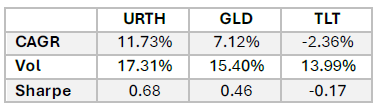
URTH delivered a compound annual growth rate of 11.73%, the highest of the group. This reflects the long-term growth engine of equities. That return came with the highest volatility at 17.31%, meaning investors had to tolerate sizable year-to-year swings. However, the Sharpe ratio of 0.68 shows that this volatility was compensated.
GLD produced a lower CAGR of 7.12% with volatility of 15.40%, only slightly below that of equities. This is an important reminder that gold is not a low-risk asset in the traditional sense. The Sharpe ratio of 0.46 indicates that gold did generate acceptable risk-adjusted returns but was much less efficient than equities. This suggests that gold’s primary value over the period was diversification rather than pure return generation.
TLT tells a very different story. Despite having the lowest volatility at 13.99%, it delivered a negative CAGR of −2.36%. Rising interest rates severely hurt long-duration bonds. This is reflected in the negative Sharpe ratio of −0.17, meaning investors took risk but were not compensated for it. The experience underscores that bonds can fail in their traditional defensive role depending on the macroeconomic regime. As a result, its primary value within a broader strategy is diversification and risk mitigation rather than consistent return generation.
Overall, the comparison shows that equities were the dominant source of wealth creation, gold played a secondary and less efficient role as a diversifier and long-duration bonds were a drag on both absolute and risk-adjusted performance. It reinforces the idea that asset class behavior is highly environment-dependent. That’s why 3 assets with low to negative correlation are selected.
Let’s now compare the results of the overall strategy.
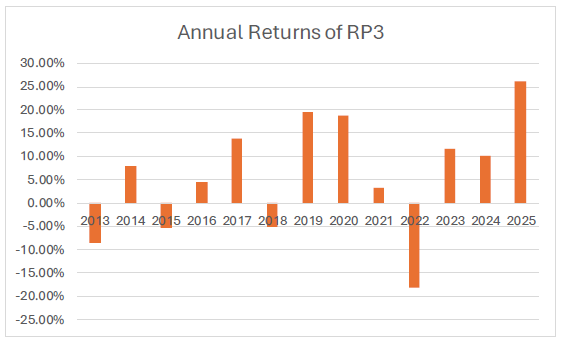
The strategy, referred to as RP3, is constructed by combining the mentioned components using an equal-weight allocation.
The sample period exhibits a generally positive long-term trajectory, despite meaningful fluctuations from year to year. In the initial phase between 2013 and 2016, returns remain relatively modest and alternate between small gains and losses. This changes from 2017 onward, when performance improves noticeably and several strong positive years emerge.
Overall, the return profile is characterized by moderate volatility punctuated by a small number of outsized years that account for a substantial share of long-term performance. Negative years are fewer and typically less severe than positive ones.
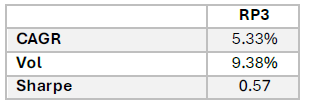
RP3 delivered an annualized return of 5.33% over the sample period, reflecting moderate capital growth. The strategy is designed to prioritize stability rather than outperformance. The strategy exhibited an annualized volatility of 9.38%, which corresponds to a moderate level of risk. Importantly, this volatility is lower than that of the individual components within the portfolio. This reduction in overall risk highlights the benefits of diversification.
The Sharpe ratio of 0.57. This reflects a reasonable level of risk-adjusted performance, which is good enough for such a simple basis strategy.
Key Takeaways
Risk premia harvesting is about bearing systematic risk, not market timing
Long-term returns come from maintaining exposure to well-documented sources of compensated risk through disciplined, rules-based strategies.
The three-asset portfolio provides regime-diverse protection
Global equities, long-duration Treasuries and gold create an “all-weather” portfolio that can withstand different economic environments.
Simplicity trumps complexity when differences are marginal
Despite the theoretical appeal of inverse-volatility weighting, the analysis shows it produces nearly identical results to equal weighting. The equal-weight approach is therefore preferable for its simplicity and ease of implementation.
Individual component performance varies dramatically by regime
This underscores why diversification across low-correlated assets matters more than individual asset performance.
Resist the temptation to “improve” a basic risk premia harvesting strategy
The biggest risk to this approach is attempting to fine-tune allocations based on macro forecasts or recent underperformance. Economic regimes are only clear in hindsight, and personal market views have no place in a systematic portfolio designed for long-term survival across full market cycles.
Conclusion
Risk premia harvesting is not about chasing alpha or outsmarting the market. It is about positioning a portfolio to earn compensation for bearing fundamental risks that persist across time. The three-asset framework presented here provides exposure to distinct sources of risk premia while maintaining low correlations that smooth returns across different macro regimes.
The numbers are not spectacular, nor are they meant to be. The strategy is designed for reliability. It survived a challenging environment for bonds, benefited from strong equity performance and demonstrated genuine diversification by exhibiting lower volatility than any of its individual components.
What matters most is not the specific historical return, but the framework itself. This is a foundational strategy, a systematic core for a portfolio. It does not rely on forecasts, market timing or manager intuition. It simply maintains exposure to multiple risk premia and rebalances mechanically to preserve the intended risk structure.
Periods of underperformance are inevitable. No strategy works in every environment. That is precisely why diversification matters.
For investors seeking a robust starting point, this three-asset approach offers exactly that: a simple, regime-aware foundation that can be implemented without complexity. Everything (your actual edge) can be built on top of this base.
Full disclosure, this strategy is a modified version of one created by Kris Longmore .
Disclaimer
The above article constitutes my or the authors’ personal views and is for entertainment purposes only. It is not to be construed as financial advice in any shape or form. Please do your own research and seek your own advice from a qualified financial advisor. I / The authors may from time to time hold positions in the aforementioned securities consistent with the views and opinions expressed in this article. The information provided in this article is not making promises, or guarantees regarding the accuracy of information supplied, nor that you guarantee for the completeness of the information here. The information in this article is opinion-based and that these opinions do not reflect the ideas, ideologies, or points of view of any organization the authors may be potentially affiliated with. The authors reserve the right to change the content of this blog or the above article. The performance represented is historical and that past performance is not a reliable indicator of future results and investors may not recover the full amount invested.
What’s one practical tip you’d give someone starting with risk-premia harvesting who’s still unsure where to begin?
By the way, I supported your work I’m building my own Substack right now, feel free to check it out too.