
EOM Effect in Zero Coupon Bonds
The Hidden Calendar Pattern in Bonds

Yeah I know, yet another post on the End-of-month effect in bonds. The end-of-month effect in bonds is a well-known seasonal pattern, but its persistence makes it worth revisiting. I already examined the effect in TLT (20+ Year Treasury Bond ETF) (see below) and explore whether a similar opportunity exists in a closely related instrument, ZROZ (PIMCO 25+ Year Zero Coupon U.S. Treasury Index ETF).
The Hidden Calendar Pattern in Bonds

In my first post on the End-of-Month (EOM) Effect, I explored the phenomenon using a simple equity–bond reversal strategy built with SPY and TLT. The idea behind that analysis was to illustrate how market flows around the turn of the month, e.g. driven by institutional portfolio rebalancing, can create (short-term) recurring patterns in asset prices. By…
Understanding the End-of-Month Effect
The basic idea is straightforward. Long-duration U.S. Treasury bonds have historically tended to outperform during the final few trading days of each month. Unlike many seasonal anomalies, this pattern has a clear structural explanation rooted in the mechanics of bond index construction.
Bond index providers add newly issued bonds to their benchmarks only at month-end, even though new bonds are issued continuously throughout the month. As a result, the effective duration of the benchmark gradually increases before the monthly rebalance.
Portfolio managers who track these indices are required to keep their portfolios closely aligned with the benchmark. When the month-end rebalance occurs, they must purchase the newly eligible bonds to restore their portfolios’ duration and composition. This creates a recurring wave of demand concentrated in the final trading days of each month.
Importantly, this buying is mechanical, it is driven by benchmark-tracking mandates. Because these purchases occur regardless of prevailing prices, they generate a predictable source of buying pressure that has historically translated into positive returns during the end-of-month window.
This structural explanation also makes the strategy more compelling than many purely statistical market anomalies. The edge exists because of an identifiable institutional process. Equally important, it provides a clear criterion for when the strategy should stop working. If bond index providers were to begin incorporating new issues continuously throughout the month instead of only at month-end, the concentrated rebalancing demand would disappear, and the seasonal effect would likely fade as well.
Extending the Strategy to ZROZ
Given the historical success of this implementation in TLT, the next question is whether the same structural effect can be exploited in other ETFs. For this purpose, I selected ZROZ, the PIMCO 25+ Year Zero Coupon U.S. Treasury Index ETF.
Testing the Theory
To evaluate this hypothesis, I compare average returns across different trading-day intervals of the month. Figure 1 presents the average returns during these intervals.
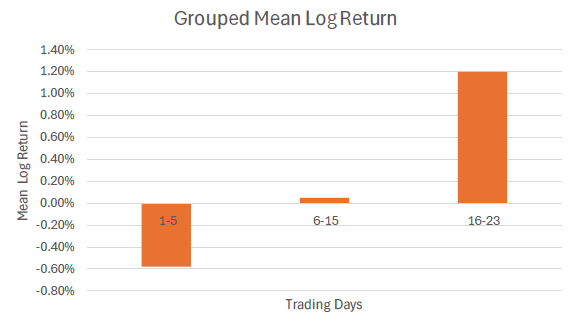
ZROZ exhibits a clear seasonal return pattern that closely aligns with the proposed end-of-month hypothesis. Average returns are negative during the first few trading days of the month. During the middle of the month, returns are approximately flat. The strongest performance is concentrated in the final trading days of the month.
Results
The following chart presents the strategy’s annual returns.
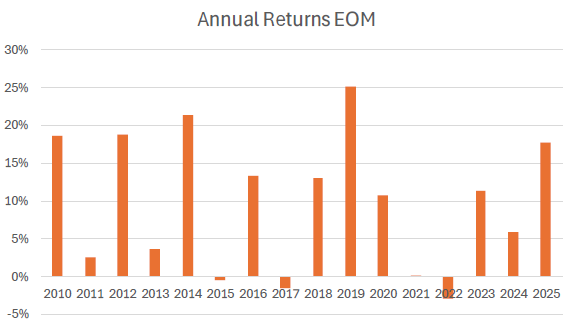
The annual return profile demonstrates that the EOM strategy has been remarkably resilient over time. Rather than relying on a small number of outsized gains, profitability is distributed across the majority of the sample period, suggesting that the underlying seasonal effect has persisted through a range of market environments.
From 2010 through 2025, the strategy generated positive returns in 13 out of 16 calendar years. Only three years (2015, 2017 and 2022) produced negative returns, and in each case the losses were relatively modest. This asymmetry between the magnitude of winning and losing years is an encouraging characteristic.
Importantly, the profitable years are not concentrated within a single market regime. Even during the highly volatile bond market environment of 2022, the strategy experienced only a modest annual loss despite one of the worst years on record for long-duration U.S. Treasury securities (ZROZ lost over 40% that year).
Figure 1 shows that the first few trading days of the month exhibit, on average, negative returns. This finding suggests that the end-of-month effect may not simply be a period of positive performance but rather part of a broader turn-of-the-month pattern in which prices strengthen into month-end and subsequently weaken once the institutional rebalancing flows have been completed.
This observation naturally leads to an extension of the original strategy. Instead of remaining in cash after exiting the long EOM position, the strategy reverses its exposure by taking a short position during the historically weak beginning-of-month period. This extended strategy, referred to as EOMS seeks to capture both sides of the seasonal effect: the systematic buying pressure at month-end and the subsequent reversal during the opening trading days of the new month.
Figure 3 presents the annual performance of the EOMS strategy.
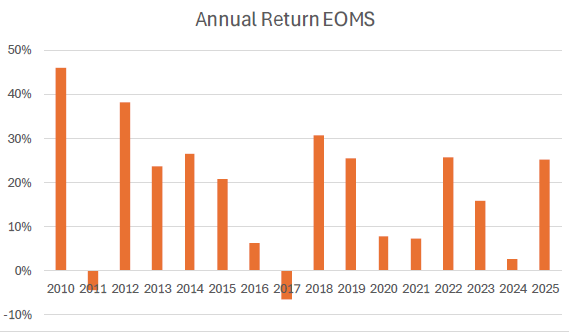
Between 2010 and 2025, the strategy was profitable in 14 out of 16 calendar years. The annual return profile of the EOMS strategy suggests that extending the original end-of-month trade with a short position during the beginning of the month substantially improves its overall performance. The strategy generates strong positive returns in the vast majority of years.
The magnitude of the positive returns is particularly noteworthy. This indicates that the enhanced strategy not only increases the frequency of profitable years but also meaningfully raises the average annual return compared with the long-only implementation.
Although the strategy is highly consistent, the annual results also demonstrate that the anomaly is not equally strong every year.
Table 1 summarizes the key performance statistics for three trading approaches: a passive buy-and-hold position in ZROZ, the original EOM strategy and the enhanced EOMS strategy.
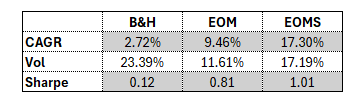
The buy-and-hold strategy delivered a CAGR of just 2.72%, while exposing investors to an annualized volatility of 23.39%. The resulting Sharpe ratio of 0.12 indicates that investors received very little return for the amount of risk assumed. This outcome is not surprising, as long-duration zero-coupon Treasury bonds are highly sensitive to changes in interest rates, leading to significant price fluctuations without consistently generating attractive long-term returns over the sample period.
Restricting exposure to the historically favorable end-of-month window dramatically improves the strategy’s characteristics. The EOM strategy increases the CAGR to 9.46%, more than tripling the return of the buy-and-hold “benchmark”, while simultaneously reducing annualized volatility. Consequently, the Sharpe ratio rises from 0.12 to 0.81. This combination of higher returns and lower volatility suggests that avoiding exposure during the less favorable parts of the month eliminates a significant amount of uncompensated risk.
The EOMS strategy further strengthens these results by exploiting not only the positive end-of-month effect but also the historically weak beginning-of-month period through short exposure. This extension nearly doubles the CAGR relative to the long-only EOM strategy. Despite the higher volatility associated with maintaining both long and short positions, the increase in return is proportionally much larger, producing the highest Sharpe ratio of 1.01 among the three approaches. Even with costs should be above 0.9.
Key Takeaways
The EOM effect is a persistent seasonal anomaly in long-duration (Zero Coupon ) Treasury bonds.
The effect has a structural explanation: It stems from bond index providers adding newly issued bonds only at month-end, creating a mechanical rebalancing need.
The structural explanation provides a clear “failure condition”: If index providers moved to continuous inclusion of new issues, the anomaly would likely disappear.
Negative returns at the start of the month: This suggest a broader “turn-of-the-month” pattern which can be harnessed (EOMS strategy)
Conclusion
The end-of-month effect continues to prove itself. It’s pattern has a clear, identifiable driver: the mechanical rebalancing behavior of index-tracking bond funds. That structural foundation is precisely what gives the strategy staying power.
The performance data make a compelling case. Simply avoiding exposure outside the end-of-month window transformed ZROZ from a volatile, low-Sharpe buy-and-hold position into a strategy with meaningfully better risk-adjusted returns. Extending the trade to capture the beginning-of-month reversal through the EOMS variant pushed those results even further, nearly doubling the CAGR of the long-only approach while still maintaining a Sharpe ratio above 1, a rare feat for such a simple strategy.
Of course, no anomaly is guaranteed to persist forever. As noted earlier, the clearest risk to this strategy would be a change in how bond indices incorporate newly issued securities. Should providers move toward continuous rather than month-end inclusion, the concentrated rebalancing flows that drive this effect would likely fade. Until that structural shift occurs, however, the evidence suggests that the end-of-month effect remains a persistent, exploitable, and well-explained market inefficiency.
AI Disclosure
Yes, I use AI.
I use it the way some people use a good editor: to trim rambling sentences, fix awkward phrasing, catch typos, tighten structure, and occasionally ask, “Does this argument actually make sense?” Sometimes I’ll even ask it to poke holes in my reasoning or point out weak spots.
I use AI as an editor, not as a thinker.
Every idea, argument, opinion, and conclusion is my own. AI helps me say what I mean more clearly; it doesn’t decide what I mean.
In other words, I outsource the copyediting, not the consciousness.
Disclaimer
The above article constitutes my or the authors’ personal views and is for entertainment purposes only. It is not to be construed as financial advice in any shape or form. Please do your own research and seek your own advice from a qualified financial advisor. I / The authors may from time to time hold positions in the aforementioned securities consistent with the views and opinions expressed in this article. The information provided in this article is not making promises, or guarantees regarding the accuracy of information supplied, nor that you guarantee for the completeness of the information here. The information in this article is opinion-based and that these opinions do not reflect the ideas, ideologies, or points of view of any organization the authors may be potentially affiliated with. The authors reserve the right to change the content of this blog or the above article. The performance represented is historical and that past performance is not a reliable indicator of future results and investors may not recover the full amount invested.