
Some Ramblings about Finance and Trading #1
Short random thoughts

This is an experiment with a new format for sharing ideas and updates. Instead of writing a full blog post for every topic, I’ll use this space to collect shorter notes, observations and small discoveries that may still be useful or interesting on their own. Some of these entries will be brief thoughts or updates that don’t (yet) justify a longer article. Others may serve as previews of larger topics that could eventually grow into full blog posts if there is enough interest or discussion around them. The goal of this post is to create a more flexible way to share work in progress, highlight smaller insights and explore ideas without waiting until they are fully developed.
EOM-Effect in 30-Year Treasuries
Yeah, I know yet another mentioning of this effect. In 2023, the ETF UTHY was launched, providing another instrument that tracks long-duration US Treasury bonds, specifically 30-year Treasuries. Since this ETF is relatively new, I wanted to examine whether the same end-of-month behavior observed in other Treasury products also appears in UTHY. To make the comparison more meaningful, I analyzed its performance alongside TLT, one of the most widely used ETFs for long-duration US Treasury exposure.
The following chart compares the end-of-month return patterns of both ETFs. The goal is to see whether UTHY exhibits a similar seasonal tendency to TLT, whether the magnitude of the effect differs. While the available data for UTHY is still limited, the comparison provides an early indication of how closely the two products align during these recurring calendar periods.
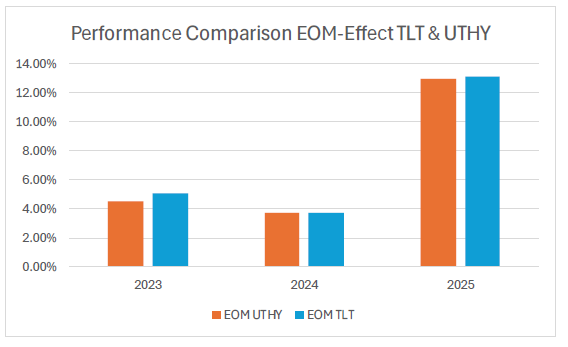
The results show that the performance profile of UTHY is very similar to that of TLT. Across most of the observed periods, both ETFs reacted almost identically to the end-of-month effect, suggesting that they capture the same underlying behavior in long-duration US Treasury bonds. The only noticeable difference appeared in 2023, where TLT delivered measurably stronger returns than UTHY during the examined windows.
At the same time, UTHY exhibited slightly lower volatility compared to TLT. However, once returns are adjusted for risk, the difference between the two products becomes negligible. In practical terms, the risk-adjusted performance of both ETFs is effectively the same, indicating that neither product demonstrates a clear structural advantage over the other.
Based on these findings, the analysis still favors the use of TLT as the primary instrument for implementing this type of strategy. TLT has a much longer trading history and higher liquidity, which make it easier to trade and integrate into systematic strategies. Since UTHY behaves almost identically while offering no meaningful improvement in returns or risk-adjusted performance, there appears to be little benefit in holding both simultaneously. From a diversification perspective, combining the two should not materially reduce risk, because both products are ultimately driven by the same segment of the US Treasury market.
“Poor Man’s” Long Volatility
Traditional long-volatility strategies are often used as portfolio diversifiers because they tend to perform well during periods of market stress, sharp equity selloffs or spikes in uncertainty. The challenge, however, is that maintaining direct long-volatility exposure can be expensive over time.
In a German blog post, Nicolas Rabener proposed an alternative approach that attempts to capture some of the defensive characteristics of long-volatility strategies without relying on explicit volatility products. His idea is what could be described as “poor man’s long volatility” (PMLV): a combination of gold exposure and a position in the JPY/AUD currency pair.
The rationale behind this construction is relatively intuitive. Gold has historically acted as a defensive asset during periods of financial uncertainty, inflation concerns or declining confidence in risk assets. At the same time, the Japanese yen is often considered a safe-haven currency, while the Australian dollar tends to behave more like a pro-cyclical or risk-sensitive currency. As a result, the JPY/AUD exchange rate can serve as a proxy for global risk sentiment, often strengthening during risk-off environments when equities struggle.
For the gold allocation, I use GLD and combine it with the JPY/AUD component to construct the PMLV strategy and compare its returns and behavior against SPY, which serves as a benchmark for US equities. The following table examines how this alternative diversification approach performs on its own and how it affects overall portfolio characteristics when combined with equities.
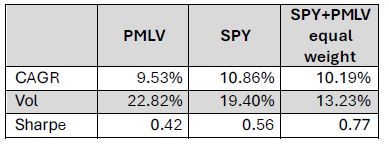
Over the observed sample period, the PMLV strategy delivered lower absolute returns than SPY while also exhibiting higher standalone volatility. The more interesting results appear when PMLV is combined with SPY in a diversified portfolio. Although the blended portfolio produced returns that were slightly lower than holding SPY alone, the reduction in overall portfolio volatility was substantial. This reduction in volatility improved the portfolio’s risk-adjusted performance meaningfully.
A key reason for this improvement lies in the relationship between PMLV and equities. The following figure illustrates the correlation between PMLV and SPY over time.
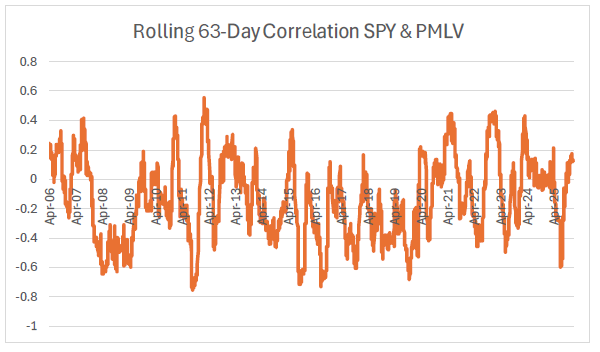
The correlation between PMLV and SPY changes significantly throughout the sample period, highlighting that the relationship between the two strategies is far from stable. At times, the two move in the same direction, while during other periods they diverge meaningfully. Over the full dataset, the correlation is positive roughly 66% of the time and negative about 34% of the time.
A practical consideration is that many investors and traders already hold some exposure to gold as part of a diversified portfolio. Since gold represents a major component of the PMLV construction, the strategy may not add as much incremental diversification in real-world portfolios as these results suggest. In many cases, investors may already be capturing part of the same defensive behavior through existing allocations.
Because of this, I am somewhat skeptical that the strategy would materially improve a portfolio that is already broadly diversified across asset classes. The improvement shown in the performance table is likely driven to a significant extent by the general effect of adding additional a (partially) correlated strategy, rather than by the unique characteristics of the PMLV components themselves. In other words, similar portfolio improvements might potentially be achieved through a variety of other diversifying assets.
This does not necessarily invalidate the concept, but it does suggest that the strategy should be evaluated in the context of an investor’s existing holdings rather than in isolation. The key question is not whether PMLV diversifies equities on paper, but whether it provides diversification benefits that are meaningfully different from exposures investors already have in their portfolios.
Disclaimer
The above article constitutes my or the authors’ personal views and is for entertainment purposes only. It is not to be construed as financial advice in any shape or form. Please do your own research and seek your own advice from a qualified financial advisor. I / The authors may from time to time hold positions in the aforementioned securities consistent with the views and opinions expressed in this article. The information provided in this article is not making promises, or guarantees regarding the accuracy of information supplied, nor that you guarantee for the completeness of the information here. The information in this article is opinion-based and that these opinions do not reflect the ideas, ideologies, or points of view of any organization the authors may be potentially affiliated with. The authors reserve the right to change the content of this blog or the above article. The performance represented is historical and that past performance is not a reliable indicator of future results and investors may not recover the full amount invested.