


Trip to the Formula Investing Zoo
Part 1: explanation of the fundamentals of the analysis, Acquirer's Multiple and Pure Charlie

In January I published an analysis of 4 different formula investing strategies in German. Now I am publishing this in English as well. The analysis will be divided in 2 parts. Part 1 will contain the explanation of the fundamentals of the analysis as well as the investment strategies Acquirer's Multiple and Pure Charlie. Part 2 will contain Magic Formula and Deep F-Value.

Note on the interpretation of results
The results in this post are based on backtests and are for informational purposes only and do not constitute investment advice or recommendations. Past performance is not indicative of future results. It cannot be ruled out that the results are distorted by survivorship bias and look-ahead bias. Transaction costs, taxes, and other practical characteristics are not taken into account, as the results are indices that are not directly investable. The data and calculation methods used may contain inaccuracies or errors, and certain assumptions have been made that may differ from reality. The results may vary depending on the data source selected. The observation period is 15 years from January 1, 2009, to December 31, 2023. Such a period is too short to make valid statements about the long-term performance of the strategies presented.
Investment universe
The investment universe is limited to the US and comprises 2,267 stocks at the start of 2009, ending with 2,377 in 2023. These are companies headquartered in the US, no ADRs, etc. In addition, the financial sector is excluded. The stocks have an average daily trading volume of at least $500,000 over the last 200 days. The smallest 30% of stocks, measured by market capitalization, are excluded. These restrictions are intended to improve the quality of the results so that they more closely reflect reality, i.e., the chosen stocks are actually tradable for investors.
Benchmark
The S&P 500 serves as the benchmark. It represents the overall market and can be traded very easily via ETFs. The S&P 500 performed very well during the period under review. Only during the COVID-19 pandemic in 2020 and 2022 were there significant setbacks.
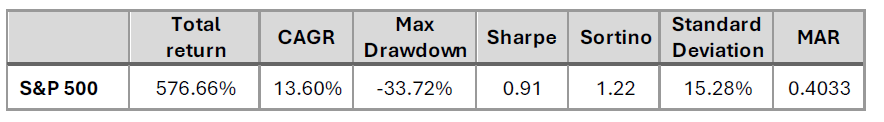
The S&P 500 has achieved an annual return of 13.60%. This is a very good figure and significantly above historical values. By way of comparison, the compound annual growth rate (CAGR) from 1964 to 2011 was 9.52%. The Sharpe and Sortino ratios are also exceptionally good at 0.91 and 1.22. For context: Sharpe ratios above 0.50 can be considered good, especially in a portfolio context. These good results are mainly due to the absence of market corrections. Outside of the pandemic period, there were no major market corrections during the period under review. The very good Sharpe and Sortino ratios should decline and thus normalize in a test over a longer observation period. For comparison, the Sharpe ratio was 0.33 from 1964 to 2011 and the Sortino ratio was 0.50. The standard deviation is at a normal level in historical comparison.
The figures clearly show that the S&P performed exceptionally well during the period under review and that it is quite difficult to outperform it.
Implementation of the strategies
A total of four strategies are considered. For each strategy, six portfolios (also referred to as variants) are created, three with 25 stocks (P25) and three with 50 stocks (P50). The stocks are equally weighted in all portfolios. Three rebalancing cycles are considered for each of the two portfolio sizes: 52 weeks (52W), 26 weeks (26W), and 13 weeks (13W). After these periods, the portfolios are rebalanced or recalculated.
Acquirer’s Multiple
The Acquirer's Multiple is an investment strategy developed by Tobias Carlisle. It is used to identify undervalued companies. The strategy is based on a single financial indicator, the earnings yield (EBIT/EV). This is a classic value indicator. The higher the value, the better. Unlike the paper by Schwartz and Hanauer, companies with a negative enterprise value are not considered.
The Acquirer's Multiple strategy generated a return of 14.2% p.a. with a Sharpe ratio of 0.57 between 2000 and 2022.
P25 Acquirer's Multiple
Figure 1 shows the cumulative performance of the individual P25 portfolios.
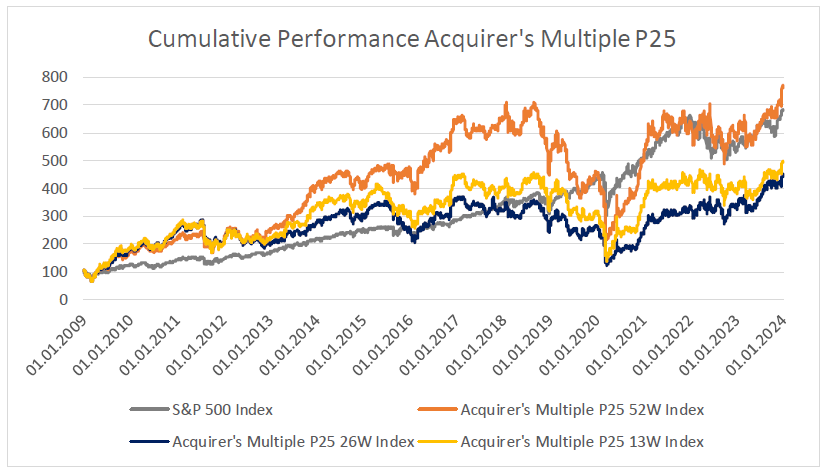
The outperformance of all Acquirer's Multiple portfolios in the early years is clearly visible. The two variants, 26W and 13W, underperform significantly. In the case of 52W, a significant decline in performance can be seen from 2018 to 2020, during the so-called quant winter. Table 2 lists the individual key figures for the variants.
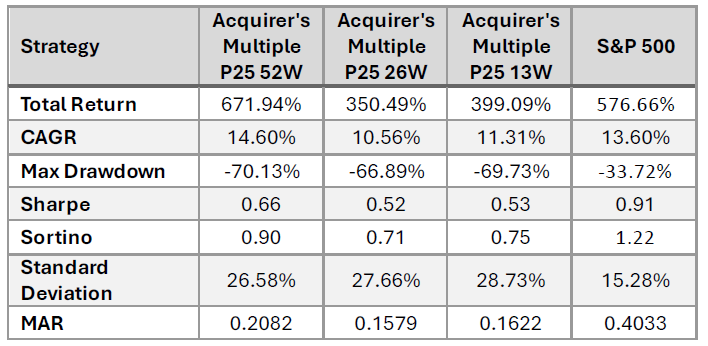
The Acquirer's Multiple P25 52W portfolio significantly outperforms the S&P 500 in terms of total return and compounded annual growth rate (CAGR). The other two variants, 26W and 13W, lag far behind the S&P 500.
All Acquirer's Multiple portfolios have significantly higher maximum losses than the S&P 500. The standard deviations of the Acquirer's Multiple portfolios are also higher, making them significantly more volatile than the S&P 500. With maximum losses of around 70%, these strategies are not for the faint of heart.
The S&P 500 outperforms all Acquirer's Multiple portfolios in terms of risk-adjusted returns, as shown by higher Sharpe and Sortino ratios and a higher MAR ratio. The exceptionally good performance and risk metrics of the S&P 500 have already been pointed out. Nevertheless, the risk-adjusted returns can still be classified as good.
P50 Acquirer's Multiple
Figure 2 shows the cumulative performance of the individual P50 portfolios:
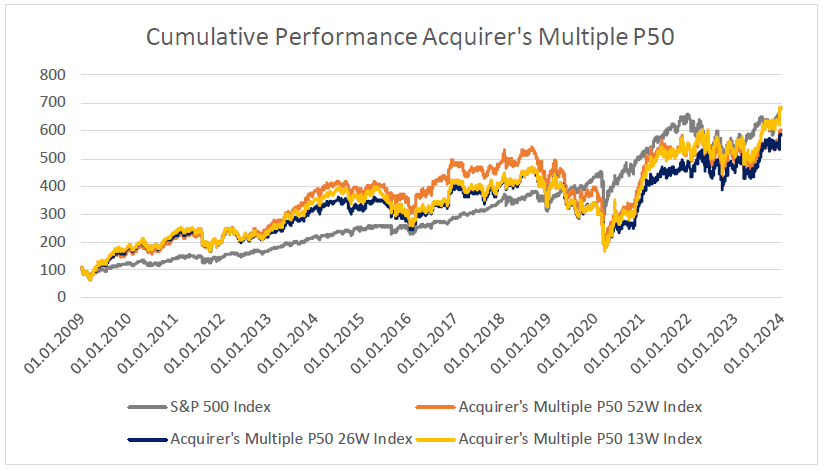
As with the P25 portfolios, the outperformance of all P50 Acquirer's Multiple portfolios is clearly evident in the early years. As with the P25 portfolios, the quant winter was a real return killer. The 52W and 26W variants were unable to catch up with the S&P 500. Only variant 13W managed to do so and slightly outperformed the S&P overall. Table 3 lists the individual key figures for the variants.
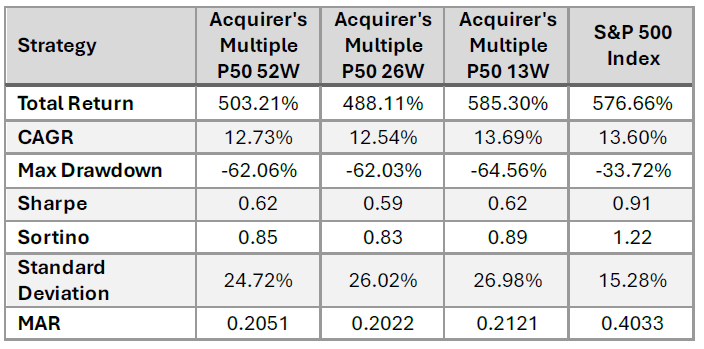
The Acquirer's Multiple P50 13W portfolio slightly outperforms the S&P 500 Index in terms of both total return and CAGR. The other two variants (52W and 26W) lag significantly behind the S&P 500.
All Acquirer's Multiple portfolios have significantly higher maximum losses than the S&P 500. The standard deviations of the Acquirer's Multiple portfolios are also higher. Compared to the P25 portfolios, the maximum losses are slightly lower, but still not for the faint of heart.
The S&P 500 outperforms all Acquirer's Multiple portfolios in terms of risk-adjusted returns, as shown by higher Sharpe and Sortino ratios, as well as a higher MAR ratio. Nevertheless, these metrics can be considered good. They outperform those of the P25 portfolios, except for the 52W variant.
Summary Acquirer's Multiple
The P25 52W variant is the only one of the six Acquirer's Multiple portfolios that outperformed the S&P 500 over the entire period under review. All other strategies only managed to do so until 2019. The maximum losses significantly exceed those of the S&P 500. Investors need strong nerves for this strategy. The risk-adjusted returns can be classified as good.
Overall, the Acquirer's Multiple strategy represents an interesting approach to quantitative investing. The derivation is very simple, using only one formula/key figure. Despite the highest loss, the P25 52W portfolio achieves the highest (risk-adjusted) returns and is the favorite among the Acquirer's Multiple variants presented.
Pure Charlie
The Pure Charlie investment strategy was developed by Tobias Carlisle as a counterpart to the Acquirer's Multiple and identifies high-quality companies. Like the Acquirer's Multiple, the Pure Charlie strategy is based on one key figure, the ROIC. The higher the return on invested capital, the better.
Since Carlisle does not specify an ROIC formula, the calculation method used by Mauboussin and Callahan is used. The name is a tribute to Charlie Munger.
P25 Pure Charlie
Figure 3 shows the cumulative performance of the individual P25 portfolios.
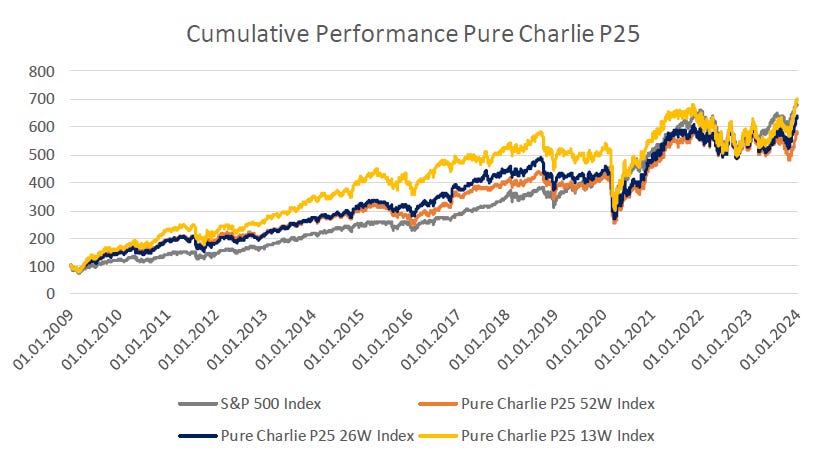
The outperformance of all Pure Charlie strategies up to 2019 is clearly evident. Over the entire period under review, only the 13W variant outperformed the S&P. Table 4 lists the individual key figures for the variants.
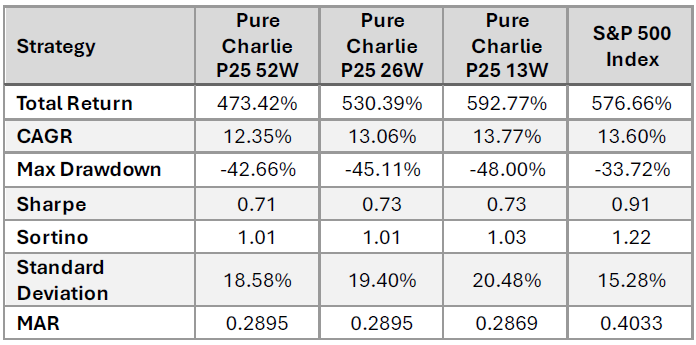
The Pure Charlie P25 13W portfolio has the highest total return and annual growth rate and is the only variant that outperforms the S&P 500 Index, albeit only slightly. The 52W variant significantly underperforms.
The S&P 500 Index shows the lowest maximum loss. The Pure Charlie portfolios show significantly higher losses, with the 13W portfolio being the most affected at -48.00%.
The S&P 500 Index has the lowest standard deviation at 15.28%. The Pure Charlie portfolios show higher values, with the 13W portfolio exhibiting the highest volatility at 20.48%.
The Pure Charlie portfolios are very close together in terms of their risk-adjusted returns. Although these are below those of the S&P 500, they can still be classified as good.
P50 Pure Charlie
Figure 4 shows the cumulative performance of the individual P50 portfolios.
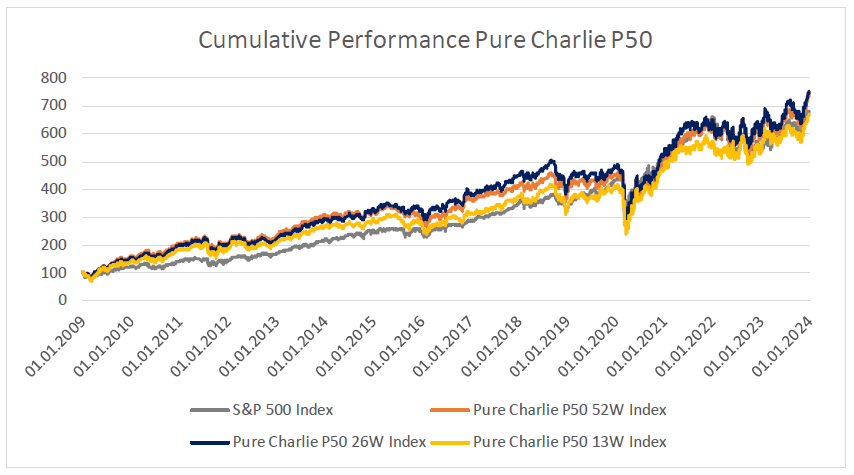
As with the P25 variant, the outperformance of all P50 portfolios up to 2019 is clearly evident. Over the entire period under review, the 52W and 26W portfolios outperformed the S&P. Table 5 lists the individual key figures for the variants.
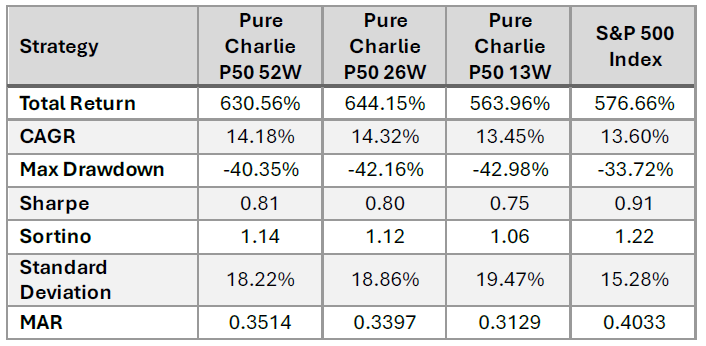
The 52W and 26W portfolios significantly outperform the S&P 500. The 13W portfolio lags only slightly behind the S&P 500.
The maximum loss for all portfolios is greater than that of the S&P 500. The 52W portfolio has the lowest maximum loss of the Pure Charlie strategy, while the 13W portfolio has the highest.
The Pure Charlie portfolios, especially 52W and 26W, are very close together in terms of risk-adjusted returns. Although they are below those of the S&P 500, they can still be classified as good.
Summary Pure Charlie
Among the P25 variants, only the 13W portfolio outperformed the S&P 500. The opposite is true for the P50 variant, where the 52W and 26W portfolios succeeded. Overall, the more broadly diversified P50 portfolios were the better choice during the period under review. They performed better despite, or perhaps because of, their lower risk.
The P50 52W variant would be the favorite, as it achieves the second-highest return, has the lowest maximum loss, and offers the best risk-adjusted return. In general, it can be said that the more broadly diversified P50 portfolios performed significantly better.
As a counterpart to the Acquirer's Multiple, the Pure Charlie strategy delivered significantly better results in four out of six portfolios. However, Carlisle shows that this is not the case when considering a significantly longer observation period.
Part 2 with Magic Formula and Deep F-Value will be published next week.
Thank you for your interest in this post. If you liked it, I would really appreciate a like, as these are very motivating.
You are also welcome to share this post with others.
Disclaimer
The above article constitutes my or the authors’ personal views and is for entertainment purposes only. It is not to be construed as financial advice in any shape or form. Please do your own research and seek your own advice from a qualified financial advisor. I / The authors may from time to time hold positions in the aforementioned stocks consistent with the views and opinions expressed in this article. The information provided in this article is not making promises, or guarantees regarding the accuracy of information supplied, nor that you guarantee for the completeness of the information here. The information in this article is opinion-based and that these opinions do not reflect the ideas, ideologies, or points of view of any organization the authors may be potentially affiliated with. The authors reserve the right to change the content of this blog or the above article. The performance represented is historical" and that "past performance is not a reliable indicator of future results and investors may not recover the full amount invested.
What is Pure Charlie P25?