

The analysis in this post builds directly on that earlier work, so I recommend reading the original post first, as it provides the necessary background and explains the underlying effect in more detail. See here:
The Four-Hour FX Trade

The FX market is relative uncorrelated to other markets which makes it interesting for a diversified portfolio. Unlike other markets the foreign exchange market never really sleeps. As trading moves from Asia to Europe and then to the United States, different investors, firms, and financial intermediaries enter and leave the market at different times. Y…
One of the results that stood out to me in the original analysis was the behavior of the JPY returns. In particular, the performance does not appear to be evenly distributed throughout the trading week.
Figure 1 shows the average returns by day of the week.
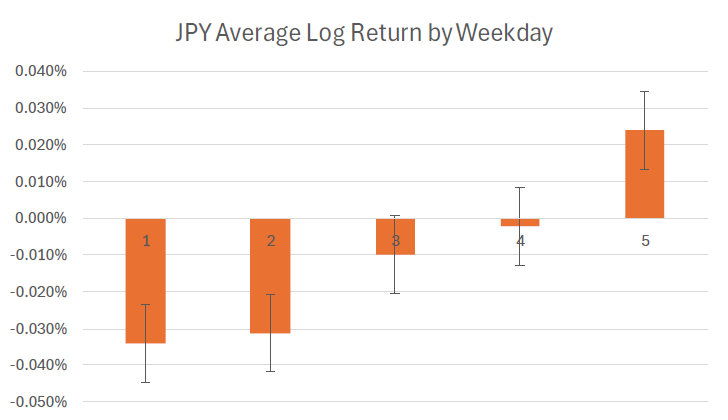
The breakdown by day reveals a clear asymmetry in the return pattern. Both Monday and Tuesday exhibit significant negative average returns. The average returns on Wednesday and Thursday are also slightly negative, but neither is significant.
Friday stands out as the only day with a positive average return. This positive performance provides an interesting contrast to the pronounced weakness observed on Monday and Tuesday. Taken together, the results suggest that the negative performance is not evenly distributed across the trading week, but is instead driven primarily by the first two trading days. This concentration in the early part of the week motivates a closer examination of the underlying dynamics and whether the observed pattern can be explained by a specific feature of the FX market.
One possible explanation for this seasonal pattern is related to the market’s tendency to seek safety ahead of the weekend and then unwind those positions at the start of the following week. Before the weekend, market participants may reduce exposure to riskier currencies and increase allocations to traditional safe-haven currencies such as the JPY.
In this interpretation, the Monday and Tuesday effect would just represent the reversal of positions that were established on Friday the previous week.
To check the plausibility of this hypothesis the “flight to safety” effect should also work on CHF, another safe-haven currency. CHF has the same negative return pattern on Monday and Tuesday but the Friday returns are also negative.
This does not necessarily rule out the “flight to safety” hypothesis, but it suggests that the mechanism is unlikely to be the complete explanation for the observed seasonality.
Testing the Theory
To investigate the proposed effect, I construct a simple trading strategy based on the observed weekly seasonality in JPY. The strategy takes a short position in JPY on Monday and Tuesday and switches to a long position on Friday.
To keep the analysis consistent with the original analysis, the strategy is only active during the same intraday window: from 11:00 AM to 3:00 PM New York time on the respective trading days.
Results
Table 1 summarizes the key performance statistics for the strategy.

The strategy generated a CAGR of 4.27. This performance was achieved with an annualized volatility of 3.49%. This results in s Sharpe ratio of 1.23 before costs.
Figure 2 shows the cumulative log return of the strategy.
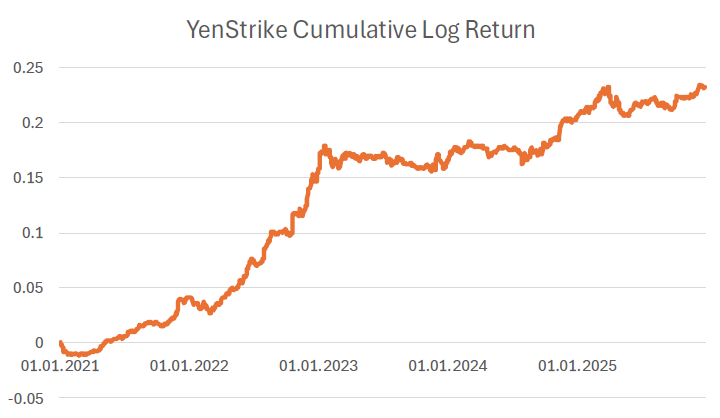
2022 stands out clearly as an outlier, contributing disproportionately to the strategy’s overall performance during the five-year period. The strategy did not record a negative year over the sample period. But that’s not extraordinary in a short sample period.
Key Takeaways
Consistent weekday pattern
Negative returns are concentrated early in the week, rather than spread evenly across all trading days.“flight to safety” mechanism
Traders may buy JPY before the weekend as a safe haven, then unwind those positions early the following week.The true driver of the JPY seasonality remains unclear
The “flight to safety” hypothesis is an incomplete explanation, leaving the door open for alternative drivers (e.g., positioning flows, options expiries, carry trade rebalancing, or other institutional flow patterns specific to).
Conclusion
The analysis reveals a seasonal pattern in JPY returns across the trading week. Average returns are negative on Mondays and Tuesdays, while Friday is the only day to exhibit a positive average return. One possible economic explanation for this pattern is a “flight to safety” mechanism. Under this interpretation, market participants may increase their exposure to JPY toward the end of the week. These positions could then be reduced at the beginning of the following week, contributing to the weaker returns observed on Monday and Tuesday.
However, the comparison with CHF, another traditional safe-haven currency, makes this explanation less conclusive. CHF exhibits a similar negative return pattern on Monday and Tuesday, which provides some support for the idea that defensive positioning may play a role. At the same time, CHF does not reproduce the positive Friday return observed in JPY. This divergence is important because, if safe-haven demand were the sole driver of the effect, a more consistent pattern across the two currencies might be expected. The evidence therefore suggests that safe-haven flows may contribute to the observed seasonality, but they are unlikely to provide a complete explanation. Identifying the precise mechanism remains an open question and warrants further investigation.
Translating the observed seasonality into a simple systematic strategy produced a Sharpe ratio of 1.23 over the five-year sample period. In addition, the strategy did not experience a losing year during the sample.
Overall, the evidence points to a recurring and economically plausible seasonal pattern in JPY returns that can be captured using a relatively simple trading rule.
Disclaimer
The above article constitutes my or the authors’ personal views and is for entertainment purposes only. It is not to be construed as financial advice in any shape or form. Please do your own research and seek your own advice from a qualified financial advisor. I / The authors may from time to time hold positions in the aforementioned securities consistent with the views and opinions expressed in this article. The information provided in this article is not making promises, or guarantees regarding the accuracy of information supplied, nor that you guarantee for the completeness of the information here. The information in this article is opinion-based and that these opinions do not reflect the ideas, ideologies, or points of view of any organization the authors may be potentially affiliated with. The authors reserve the right to change the content of this blog or the above article. The performance represented is historical and that past performance is not a reliable indicator of future results and investors may not recover the full amount invested.
Good that you checked CHF instead of stopping at the yen. Since the Friday doesn't show up there, I'd look at the carry side of your list: short-yen positions cut before the weekend and put back on Monday. If that's the driver it should be visible in positioning data, and that's also what tells you when it stops working. And if you ever take it toward trading, 4.27% a year over three four-hour windows a week is under 3bp a window, so I'd want a fresh period and a real spread series from the venue first.