
F-Score vs FS-Score
A Comparison between a popular investing formula and its improvement


As previously announced, I took a closer look at the Piotroski F-Score and the FS-Score from Gray and Carlisle. The Piotroski F-Score is a popular investment formula that has been modified by Gray and Carlisle. This article shows whether the original or the modification is better.
Basics
The F-Score is used to identify fundamentally strong stocks within the cheapest stocks in the investment universe. Piotroski defines a cheap stock or a “value stock” as a stock with a high book value relative to its market price (in other words, a low price-to-book ratio). He wanted to find a better way to invest in visually cheap stocks. The majority of stocks with a low price-to-book ratio (around 57%) underperform the market over one and two-year periods. Piotroski found that he could improve the return of a low price-to-book ratio portfolio by at least 7.5% per year by identifying financially strong value stocks using his F-Score.
Piotroski selected nine fundamental signals to measure three areas of a stock's financial stability:
Profitability
Financial leverage/liquidity
Operating efficiency.
Each fundamental signal classifies into mutually exclusive states, either as “good” or “bad”. Each analyzed fundamental signal is expressed as a binary result. In other words, if the analyzed fundamental signal is good, it is marked with a one, and if the analyzed fundamental signal is bad, it is marked with a zero.

Carlisle and Gray's current profitability variables are similar to Piotroski's profitability variables, except that they replace the CFO variable with free cash flow divided by total assets (FCFTA). They make this change to account for the impact of capital expenditures on the stock's cash flow. They also remove the ΔROA variable from this category and place it in the “recent operational improvements” category along with the new ΔFCFTA variable, as they believe this is a more intuitive category for these variables.
The “recent operational improvements” category corresponds roughly to the “operating efficiency” section of the F-Score. However, it also contains the ΔROA and the ΔFCFTA.
Both F-Score and FS-Score assume that an increase in leverage, a deterioration in liquidity or the use of debt financing are a bad signal for financial health. The variables measure changes in the capital structure and the ability of the share to meet future debt service obligations. The stability category of the FS-Score differs from that of the Piotroski F-Score in one important respect. It replaces the equity issuance variable of the F-Score with net equity issuance, which is defined as issuance less buybacks. This change is minor but important, as equity issuance can be a misleading metric. For example, many companies issue shares for a variety of reasons unrelated to financial health, including management or employee incentive programs. A company may issue a small number of shares to compensate the CEO, but at the same time launch a large buyback program that dwarfs the number of shares issued to the CEO.
The F-Score has 9 variables and the FS-Score has 10. With these changes, the FS-Score is, from a fundamental point of view, an improvement on the original Piotroski F-Score.
Backtests
It cannot be ruled out that the results of the backtests are distorted by survivorship bias and look-ahead bias. Transaction costs, taxes and other operational characteristics are not taken into account as the results relate to indices that are not directly investable. The data and calculation methods used may contain inaccuracies or errors and certain assumptions have been made which may differ in reality. The results may vary depending on the data source selected. The observation period is 16 years from 01.01.2009 to 31.12.2024. Such a period is too short for valid statements about the long-term performance of the strategies presented.
In addition to the book value/market value ratio (inverted P/B ratio), EV/EBIT and my Value Composite, which I have already presented here, are also used. Briefly summarized, the Value Composite is made up of the key figures P/BV, EV/EBIT, EV/S and GPA.
Three portfolios with 25 shares (P25) and 50 shares (P50) are created for each of the F- and FS-Score strategies. The shares are equally weighted in all portfolios. Three rebalancing cycles are considered for each of the two portfolio sizes: 52 weeks (52W), 26 weeks (26W) and 13 weeks (13W). The portfolios are rebalanced or recalculated after these periods. The results of the F- and FS-Score strategies are compared with each other for each value indicator.
B/M-Strategy
Table 2 lists the individual key figures for the P50 portfolios of the B/M strategy.

The FS-Score portfolios outperform the respective F-Score portfolios, except for the 13W portfolio. The Sharpe and Sortino ratios are higher for the FS-Score portfolios, meaning that they achieve a higher risk-adjusted return. Volatility is at a similar level in all portfolios. The 26W portfolios have the highest volatility.
Only the 52W and 26W variants of the FS-Score portfolio outperformed the S&P 500 over the entire period under review.
Table 3 lists the individual key figures for the P25 portfolios of the B/M strategy.
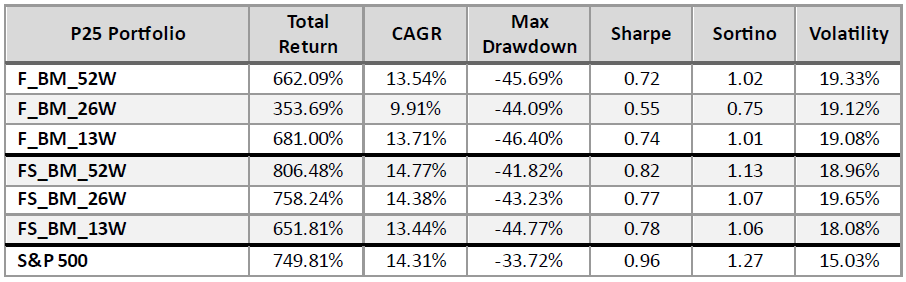
As with the P50 portfolios, the FS-Score portfolios outperform the respective F-Score portfolios, with the exception of the 13W portfolio. The Sharpe and Sortino ratios are higher for the FS-Score portfolios, which means that they achieve a higher risk-adjusted return. Volatility is higher for the F-Score portfolios, except for the 26W portfolio. As expected, volatility is higher in the P25 portfolios than in the more broadly diversified P50. As with the P50 portfolios, the 26W variant has the highest volatility.
As with the P50 portfolios, only the 52W and 26W variants of the FS-Score portfolio outperformed the S&P 500.
Conclusion B/M strategy
Although traditional value metrics, especially B/M, have been declared dead, the overall performance can be classified as good, despite the underperformance of some portfolios in relation to the S&P 500. When comparing with the S&P 500, it should be noted that most portfolios beat the S&P 500 in the early years of the period under review. The S&P 500 has delivered a very strong performance in recent years, especially since the pandemic, while other strategies have weakened. Therefore, looking at how many months the portfolios outperformed the S&P 500 during the period under review can provide additional insights into the evaluation of the portfolios. This is shown in Table 4.

However, only 4 of the 12 portfolios outperformed the S&P 500. The S&P 500 performed above average in the period under review. 4 portfolios outperformed the S&P 500 in at least 97% of the months. A further 5 portfolios outperformed the S&P 500 in over 50% of the months.
In general, the FS-Score portfolios outperformed the F-Score portfolios, with the exception of the 13W portfolios.
It is noticeable in the FS-Score portfolios that the return decreases the more frequently rebalancing is carried out. This is not the case for the F-Score portfolios.
EV/EBIT strategy
Table 5 lists the individual key figures for the P50 portfolios of the EV/EBIT strategy.

The FS-Score portfolios outperform the respective F-Score portfolios. The Sharpe and Sortino ratios are higher for the FS-Score portfolios, meaning that they achieve a higher risk-adjusted return. The maximum loss is highest in the F-Score 52W portfolio. This is unusual, as the 13W portfolios usually have the highest loss. Volatility is at a similar level in all portfolios, only the F-Score 52W portfolio stands out.
No portfolio was able to outperform the S&P 500.
Table 6 lists the individual key figures for the P25 portfolios of the EV/EBIT strategy.

The FS-Score portfolios outperform the respective F-Score portfolios, except for the 13W portfolio. The Sharpe and Sortino ratios are higher for the FS-Score portfolios, meaning that they achieve a higher risk-adjusted return. Volatility is at a similar level in all portfolios.
No portfolio was able to outperform the S&P 500.
Conclusion EV/EBIT strategy
The performance of the EV/EBIT strategy is significantly worse than expected, as the EV/EBIT ratio is a component of successful investment strategies such as Acquirers Multiple and Magic Formula.
Table 7 shows the outperformance in months.

Surprisingly, none of the EV/EBIT strategy portfolios outperformed the S&P 500. Only one portfolio outperformed the S&P 500 in more than 90% of the months. 8 other portfolios outperformed the S&P 500 in more than 50% of the months. In general, the FS-Score portfolios outperformed the F-Score portfolios.
It is noticeable in the FS-Score portfolios that the return decreases the more frequently rebalancing is carried out. This is not the case for the F-Score portfolios.
Value Composite strategy
Table 8 lists the individual key figures for the P50 portfolios of the value composite strategy (VCOMP).

The FS-Score portfolios outperform the respective F-Score portfolios, except for the 13W portfolio. The Sharpe and Sortino ratios are higher for FS-Score portfolios, so they achieve a higher risk-adjusted return. Volatility decreases in the F-Score portfolios the more frequently rebalancing is carried out. In the FS-Score portfolios, it is the other way around.
Only the 52W and 26W variants of the FS-Score portfolio and the 52W F-Score portfolio outperformed the S&P 500.
Table 9 lists the individual key figures for the P25 portfolios of the Value Composite strategy.

As with the P50 portfolios, the FS-Score portfolios outperform the respective F-Score portfolios, with the exception of the 13W portfolio. The Sharpe and Sortino ratios are higher for FS-Score portfolios, so they achieve a higher risk-adjusted return.
Only the 52W and 26W variants of the FS score portfolio outperformed the S&P 500.
As expected, volatility is higher in the P25 portfolios than in the more broadly diversified P50. As with the P50 portfolios, the 52W variant has the highest volatility.
Conclusion Value composite strategy I have already described the advantages of a value composite here.

This is also reflected in its performance.
Table 10 shows the outperformance in months.

Only 5 of the 12 portfolios outperformed the S&P 500 over the period under review. However, 3 portfolios outperformed it in at least 97% of the months. Only one portfolio fell below the 50% mark.
In general, the FS-Score portfolios outperformed the F-Score portfolios, with the exception of the 13W portfolios.
It is noticeable in the FS-Score portfolios that the return decreases the more frequently rebalancing is carried out. In the F-Score portfolios, this is only the case in the P50 portfolios.
Overall Conclusion
The 52W and 26W F-Score portfolios outperform their F-Score equivalents. Only for the 13W portfolios is it the other way around. As a rule, the volatility of the FS-Score portfolios is also lower. This means that they also have better Sharpe and Sortino ratios, which demonstrate a better risk-adjusted return.
The 52W portfolios have often performed best. Accordingly, a faster rebalancing rhythm was not rewarded.
The S&P was beaten by 9 out of 36 portfolios. This is a poor ratio, but it also illustrates the extremely good performance of the S&P 500 over the period under review. Looking at the outperformance in months, however, 15 of the 36 portfolios were able to beat it in at least 90% of the months.
Overall, it can be seen that Gray and Carlisle's FS-Score is an improvement on the Piotroski F-Score. Accordingly, the use of the FS-Score instead of the F-Score is recommended. The value component was originally B/M, which continues to perform surprisingly well.
I did expect the Value Composite strategy to perform significantly better than the B/M strategy in general. The difference is much smaller than expected.
The EV/EBIT portfolios perform surprisingly poorly. However, this illustrates that individual ratios can have bad periods and underlines the advantages of using composite ratios.
In general, it is worth integrating the FS-Score into your own investment strategy.
Disclaimer
The above article constitutes my or the authors’ personal views and is for entertainment purposes only. It is not to be construed as financial advice in any shape or form. Please do your own research and seek your own advice from a qualified financial advisor. I / The authors may from time to time hold positions in the aforementioned stocks consistent with the views and opinions expressed in this article. The information provided in this article is not making promises, or guarantees regarding the accuracy of information supplied, nor that you guarantee for the completeness of the information here. The information in this article is opinion-based and that these opinions do not reflect the ideas, ideologies, or points of view of any organization the authors may be potentially affiliated with. The authors reserve the right to change the content of this blog or the above article. The performance represented is historical" and that "past performance is not a reliable indicator of future results and investors may not recover the full amount invested.