


Trip to the Formula Investing Zoo - Part 2
Magic Formula and Deep F Value

This is part 2 of my analysis on some formula investing strategies. If missed part 1 you can find it here.
Magic Formula
Joel Greenblatt's Magic Formula strategy combines the Acquirer's Multiple and Pure Charlie strategies. It considers both the valuation level (EBIT/EV) and the quality/profitability (ROIC). Both metrics are ranked individually. The ranks are then added together. Warren Buffett's approach is to buy good companies at a fair price. The Magic Formula quantifies this approach.
For reasons of comparability with the Pure Charlie strategy, Greenblatt's calculation method is not used for the ROIC indicator, but rather the calculation method of Mauboussin and Callahan.
P25 Magic Formula
Figure 5 shows the cumulative performance of the individual P50 portfolios.
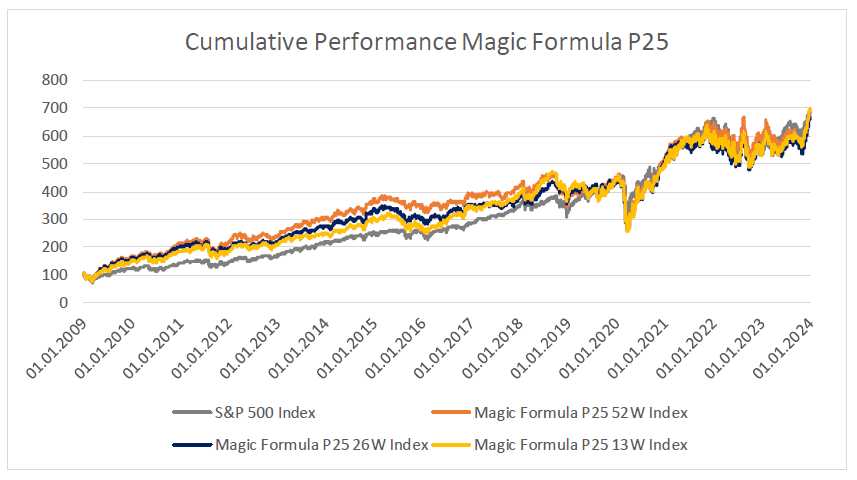
As with the previous strategies, the P25 Magic Formula portfolios outperformed the S&P 500 until 2019. Since then, they have not deviated significantly from the S&P 500.
Table 6 lists the individual key figures for the variants.
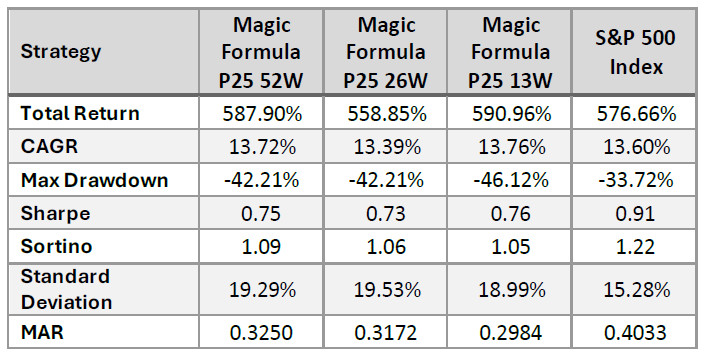
The returns are all in a similar range, with the 13W portfolio showing the highest return and the 26W portfolio the lowest. The S&P 500 is in the middle of the pack.
In terms of maximum loss, the S&P 500 performs best at -33.72%. The Magic Formula strategies show higher maximum losses, with the 13W portfolio recording the largest decline at -46.12%.
The S&P 500 has the best risk-adjusted return. The Magic Formula strategies have lower Sharpe and Sortino ratios, but these are very similar to each other. The values can be classified as good.
P50 Magic Formula
Figure 6 shows the cumulative performance of the individual P50 portfolios.
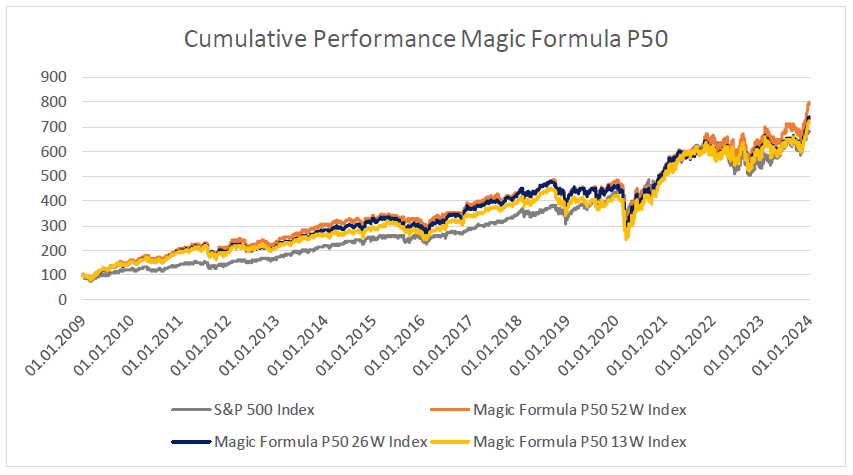
The P50 Magic Formula portfolios outperformed the S&P 500 until 2019. After that, they did not differ significantly from the S&P 500 until 2023. Table 7 lists the individual key figures for the variants.
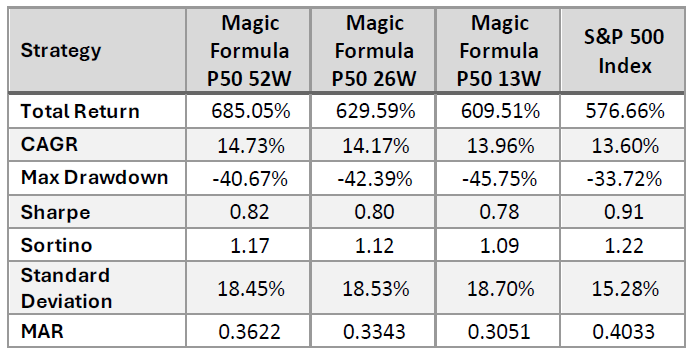
All P50 portfolios outperform the S&P 500, with the 52W portfolio significantly outperforming it. Compared to previous strategies, the P50 Magic Formula strategy is the first in which all portfolios outperform the S&P 500.
In terms of maximum loss, the S&P 500 Index performs best at -33.72%. The Magic Formula portfolios show higher maximum losses, with the 13W portfolio recording the largest decline at -45.75%.
The S&P 500 has the best risk-adjusted return. The Magic Formula strategies have lower Sharpe and Sortino ratios, but these are very similar to each other. The values can be classified as good.
Summary Magic Formula
Both P25 and P50 portfolios achieved solid results, with the P50 portfolios even achieving the best results of all the strategies tested to date. The more broadly diversified P50 portfolios achieve better results than the P25 portfolios.
The P50 52W variant would be the favorite, as it has the best return and at the same time the lowest maximum loss and the lowest volatility.
One criticism of the Magic Formula is that the returns stated by Greenblatt could not be verified/repeated in any other test. The most likely explanation is that the results were distorted by survivorship bias and look-ahead bias. Nevertheless, the Magic Formula outperforms the market over longer periods.
During this period, the Magic Formula outperformed the Acquirer's Multiple. However, when viewed over longer periods, the results are mixed. Carlisle shows that the Acquirer's Multiple achieves significantly better results. Schwartz and Hanauer's results are mixed.
During the period under review, quality was more important than the valuation level. Nevertheless, the Magic Formula achieved better results than the Pure Charlie strategy. This shows that quality/profitability is not everything.
Deep F****** Value
The strategy is referred to below as Deep F Value. It focuses on buying shares in companies whose liquid assets exceed their market value and financial liabilities (negative enterprise value). The market assumes that no value is generated for shareholders through the use of liquid assets.
The lack of companies trading at a negative enterprise value means that this strategy is highly concentrated. The 25 stocks for the P25 portfolios could rarely be achieved. Accordingly, no subdivision into P25 and P50 portfolios is made. Normally, the portfolio consists of three to ten stocks. However, periods in which there is not a single position in the portfolio must also be expected.
The stock universe is the same as for the other strategies, with the exception that companies from the biotech sector are excluded.
Deep F Value
Figure 7 shows the cumulative performance of the individual portfolios over time.
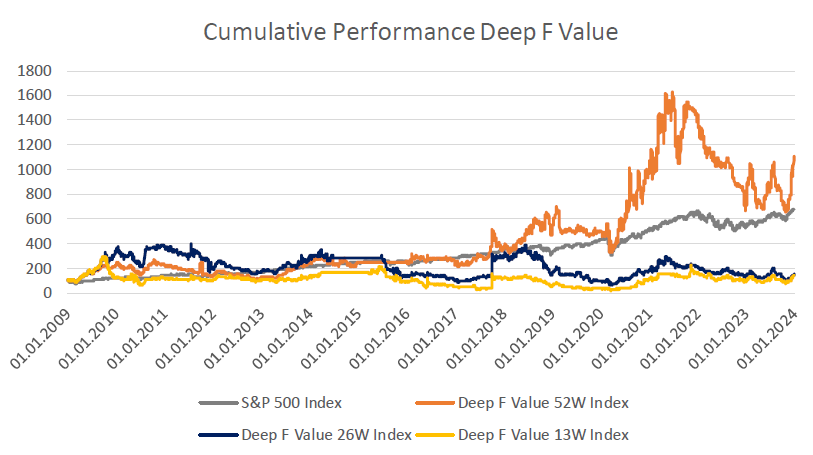
The most striking feature is the discrepancy in the cumulative performance of the individual portfolios. While the 52W portfolio significantly outperformed the S&P 500, the other two portfolios achieved extremely poor returns. The results were also subject to high volatility. This significant outperformance of the 52W portfolio has only been evident since 2020. Prior to that, the portfolio performed similarly to the S&P 500.
In 2014 and 2015, the portfolios were (partly) not invested at all due to a lack of stocks with negative enterprise value. Table 8 lists the individual key figures for the variants.
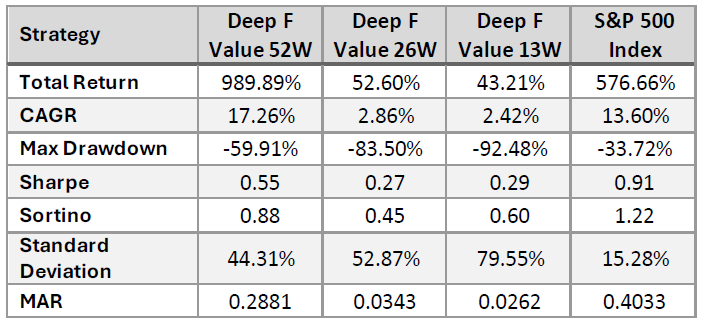
The 52W portfolio performs very well and significantly outperforms the S&P 500. The other two portfolios not only underperform, but actually generate losses. After 15 years, the 26W portfolio has lost around half of the capital invested. The losses in the 13W portfolio are even greater. The 52W portfolio has only been significantly outperforming since 2020. This means that the period of outperformance is quite short. Accordingly, it is not possible to say whether this can also be achieved in the future.
In addition, there are some extreme maximum losses. Although this is high in the 52W portfolio at around 60%, it is still bearable. The opposite is true for the other two portfolios. They generate maximum losses of more than 80%!
The volatility in these portfolios is also extreme. Accordingly, the risk-adjusted returns are low, although the Sharpe and Sortino ratios in the 52W portfolio are still acceptable.
Summary Deep F Value
The extreme difference in returns between the 52W portfolio and the other two is surprising. Accordingly, it can be assumed that something must first change operationally at these companies before the market reacts. Such an operational change will take more than one or two quarters. A longer holding period could probably improve performance further.
The clear favorite among the three portfolios is the 52W. With this strategy, investors need to sit tight and exercise patience. However, it is not recommended as a sole strategy, as it is too volatile and concentrated.
In addition, there may be (prolonged) periods during which no investments are made due to a lack of suitable stocks. The low correlation with the overall market and probably also with other investment strategies makes it a good addition to a portfolio consisting of various systematic strategies.
Thank you for your interest in this post. If you liked it, I would really appreciate a like, as these are very motivating.
You are also welcome to share this post with others.
Disclaimer
The above article constitutes my or the authors’ personal views and is for entertainment purposes only. It is not to be construed as financial advice in any shape or form. Please do your own research and seek your own advice from a qualified financial advisor. I / The authors may from time to time hold positions in the aforementioned stocks consistent with the views and opinions expressed in this article. The information provided in this article is not making promises, or guarantees regarding the accuracy of information supplied, nor that you guarantee for the completeness of the information here. The information in this article is opinion-based and that these opinions do not reflect the ideas, ideologies, or points of view of any organization the authors may be potentially affiliated with. The authors reserve the right to change the content of this blog or the above article. The performance represented is historical" and that "past performance is not a reliable indicator of future results and investors may not recover the full amount invested.